
If you’ve ever taken a statistics class, the words ‘standard deviation’ might intimidate you. This complex formula provides insightful information for datasets that averages alone cannot reveal, and thankfully, Excel makes calculating this statistic easier than putting pencil to paper.
Standard deviation is frequently used by financial professionals as it can help determine risks in stock portfolios and is often applied to return on investment (ROI).
For marketing professionals, standard deviation can reveal variabilities and risks in datasets that will ultimately help guide campaign decisions.
What is standard deviation?
Simply put, standard deviation is a mathematical term that measures the variation in a set of values. In marketing, standard deviation can help account for widely varying costs or sales. If the numbers in a data set are spread far apart, they have a higher standard deviation.
This measurement can help assess risk when deciding how much budget can be allocated toward certain campaigns based on the standard deviation of the ROI, just to name one example.
How to Calculate Standard Deviation in Excel
There are six standard deviation formulas in Excel, which will be used based on whether you need to calculate sample standard deviation or population standard deviation. This is easy to identify in Excel, as the three formulas for population standard deviation include a P (.P, PA, or P at the end of STDEV).
- STDEV.S
- STDEVA
- STDEV
- STDEV.P, STDEVPA, STDEVP
STDEV.S
If you are dealing with sample standard deviation and do not need to account for text or logical values, STDEV.S is the formula you will use to calculate standard deviation in Excel.
STDEVA
Alternatively, if you do need to account for text and logical values, use STDEVA, which will consider text and FALSE logical values to 0, while TRUE logical values will be read as 1.
STDEV
STDEV is simply the sample standard deviation formula that will work with older forms of Excel (2007 and before). It is the same as STDEV.S.
STDEVP, STDEVPA, STDEVP
You will almost exclusively use STDEV.S, STDEVA, or STDEV. When determining population standard deviation, you would have to include all datasets for the entirety of the population.
This can actually be far more data and much less useful than examining a smaller portion of the data, or a sample, in which case you would use one of the sample standard deviation formulas.
If you did, for some reason, need to determine the population standard deviation, you could still retrieve sample standard deviations and apply them to the larger dataset. The likelihood of needing these population standard deviation formulas is slim.
As stated by Microsoft, “[STDEVP] has been replaced with one or more new functions that may provide improved accuracy and with names that better reflect their usage. Although this function is still available for backward compatibility, you should consider using the new functions from now on, because this function may not be available in future versions of Excel.”
Sample of Standard Deviation in Excel
STDEV.S, STDEVA, or STDEV will be the most common formulas to use for marketers looking to calculate sample standard deviation in Excel.
These formulas specifically calculate standard deviation for a sample of a dataset, so the result will determine the amount of variability from the average (mean) of the data.
Next, we will determine how to find and use standard deviation formulas in an Excel spreadsheet.
Standard Deviation Excel Formula
As mentioned above, there are a total of six standard deviation Excel formulas, although you’ll only need one or two of them (depending on the version of Excel you use).
The syntax of the standard deviation formula in Excel for STDEV.S is
STDEV.S(number1,[number2],...)
Number1 is required and refers to “The first number argument corresponding to a sample of a population. You can also use a single array or a reference to an array instead of arguments separated by commas,” as explained by Microsoft.
Number2, … is optional. You can include up to 254 number arguments that refer to sample sets or data of a population, or you can use an array or reference to an array instead of number arguments.
This is the STDEV.S formula used by Excel:
x is the sample mean AVERAGE(number1,number2,…) and n is the sample size. Excel thankfully makes light work of applying this formula to data to calculate standard deviation.

Image via Paige Bennett
Excel Standard Deviation Function
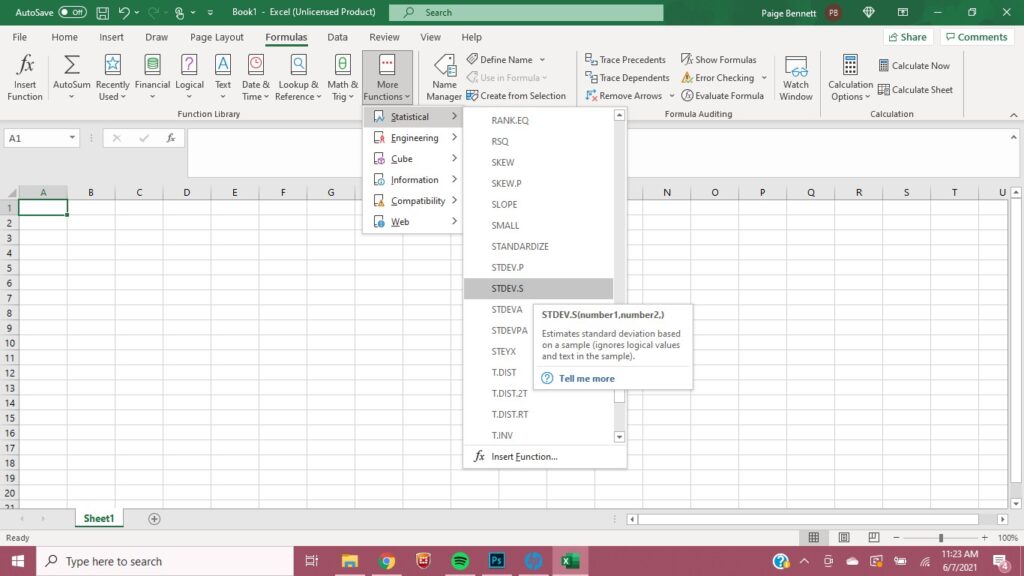
How does one find the Excel standard deviation function that they need? In Excel, navigate to the “Formulas'' header in the topmost navigation bar. For Excel versions after 2007, the second navigation bar offers a list of popular formulas, and at the end, “More Functions.” Click “More Functions” then “Statistical” and finally scroll down to the STDEV.S or other standard deviation formula for which you need. You can then input Number1 and Number2, ….
Those using an older version of Excel will not have the STDEV.S formula, but they will similarly be able to navigate to STDEV.
Why Standard Deviation is Important to Marketers
Perhaps this seems simple to some marketing professionals, or maybe this is a lot of statistical speak that sounds complex. Either way, mastering this formula and Excel function is crucial for marketers.
In marketing, discussing averages for datasets is commonplace, and this can be insightful. But it can also leave out some crucial information that could impact a campaign.
Standard deviation can show risks, volatility, or variability in a dataset. An average might show a promising campaign to allocate money toward, but standard deviation can show the potential risk and reward of a campaign. Together, averages and standard deviations can offer a comprehensive look at a dataset, so marketers can make the best decisions based on all of the information at hand.
For example, let’s say we have two companies with different order averages.
Company one has an order average of $1,000. Company two has an order average of $1,500.
But Company two has a standard deviation of $500, while Company one has a standard deviation of $50. Company two has a higher order average on the surface, but a deeper dive shows that it is riskier.
Standard Deviation Can Help Marketers Assess Risk
Averages can be meaningful in showing marketers promising campaigns and to forecast their results. But what averages don’t show are the risk and variability within the data.
A higher average sales number might not show a huge range of variability, and ultimately, risk. While standard deviation has long been used in finance to assess risk of stock portfolios and help professionals determine where to invest or what to expect for ROI, marketers can also benefit from using this statistical analysis in their own work.
They just might find some profitable surprises and avoid risky, volatile campaigns or companies by looking at both averages and standard deviation when making decisions.