You don’t want to waste time simply guessing what a prospect or customer wants and needs from your business or how they’ll react to a certain marketing campaign or strategy that you plan to implement.
Rather, you can turn to the process of data-driven marketing to make informed decisions that are based on real data to ensure your marketing efforts are relevant to prospect and customer interests and behaviors.
Now you might be thinking about the fact that your business has a large volume of complex data that are dispersed across multiple sources — this is where data mapping comes in handy.
Data Mapping
Data mapping is a key part of data management and data integration. That’s because it ensures you’re looking at and considering all of your data and doing so accurately — in other words, data mapping is what allows you to integrate your data from multiple sources.
In this blog post, we’ll talk more about what data mapping is, why it’s useful, data mapping techniques, and data mapping tools.
What is data mapping?
Data mapping is the process of matching data fields or elements from a source, or sources, to their related data fields in another destination — it’s how you establish relationships between data models that are in different sources or systems. Data mapping software and tools automatically match data fields from one data source to another for you.
Data mapping allows you to organize, distill, analyze, and understand vast amounts of data that live in various locations so you can draw conclusions and insights.
Why is data mapping useful?
Here are some more reasons why data mapping is both useful and necessary:
- Integrate, transform, and migrate data as well as create data warehouses easily.
- Establish direct relationships between your data across multiple sources at once.
- Ensure your data is high quality and accurate (data mapping software can automatically flag inconsistencies and data that isn’t high quality or accurate).
- Identify real-time trends and share data reports with team members both easily and efficiently.
- Ensure you’re getting the most out of your data and applying insights and learnings appropriately.
- Use data mapping software to simplify (and automate much of) the process of code-free data mapping.
Data Mapping Examples
A business like Amazon may use data mapping to accurately target you. They do this by pulling insights from your browsing habits, reviews, purchase history, and time on page. They can then pull and connect that data to/with data from other sources such as demographic information.
By combining these types of data sources, Amazon has the necessary information to target you with certain products and personalize your shopping experience in a number of ways (e.g. based on challenges you may be facing, geographic location, experience level, interests, education, nationality, age, and more).
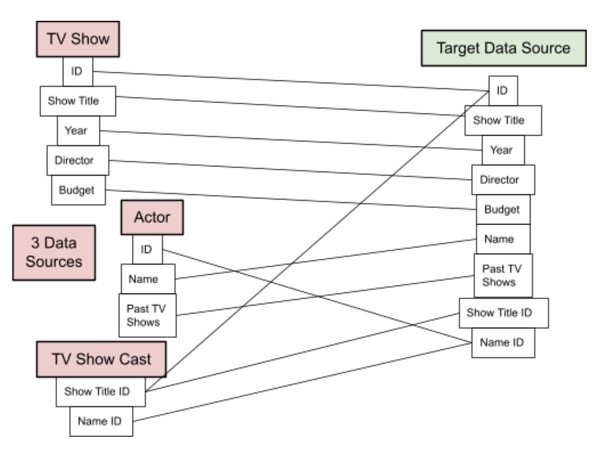
Let’s consider another data mapping example — say you work for a TV network and you’re looking to organize TV shows on the network, actors who appear on the network, and actors within a show that appears on the network. The sharing of data between the three sources may look something like this:
Data Mapping Techniques
Within data mapping, there are three main techniques that are used — manual mapping, semi-automated mapping, and automated mapping. Let’s talk about what each of these techniques entails.
1. Manual Data Mapping
Manual data mapping requires professional coders and data mappers — IT will code and map your data sources. Although this is a heavy lift and requires professional help, it allows you to fully control and customize your maps.
2. Semi-automated Data Mapping
Semi-automated data mapping (or schema mapping) requires some coding knowledge and means your team will be moving between both manual and automated data mapping processes (hence the name of this technique).
Data mapping software creates a connection between the data sources and then an IT professional reviews those connections and makes manual adjustments as needed.
3. Automated Data Mapping
Automated data mapping means a tool will take care of all aspects of the data mapping process for you, making it an ideal option, if you are not/ don’t have access to a coder. This type of software will typically allow for drag-and-drop mapping. You just need to learn how to use the tool (and pay for it).
Speaking of the tools that will automate the process of data mapping for you, let’s review some of your options next.
Data Mapping Tools
Data mapping tools and software make the process of data mapping —including visualizing and interpreting your data — easier. There’s no code needed, they often have a drag-and-drop user interface (UI), and you can implement them on your team no matter your level of technical experience. Many data mapping tools also have the ability to help you with other data management tasks such as data migration.
1. Bloomi
Price: Free 30-day trial; contact for a quote.
Bloomi, which is owned by Dell, is an iPaaS solution — that’s both cloud-native and scalable — that connects both cloud and on-premise data and applications. Design cloud-based integrations, which the tool refers to as Atoms. Then, you can begin transferring data between the cloud and your on-premise apps.
Bloomi’s data mapping functionality translates electronic data interchange (EDI) for you. The tool has a drag-and-drop UI that makes data mapping easy as well as a library of available connectors so you can establish integrations quickly.
2. Tableau

Price: Free 30-day trial; $12-$70/ user/ mo.
Tableau is a visual analytics and business intelligence platform with data management and data mapping tools. Whether your data is in spreadsheets, Apache Hadoop, databases, the cloud, etc., the platform allows you to connect and begin visualizing your data in seconds without code.
Tableau regularly populates your most recent data (on a schedule that you can adjust). The drag-and-drop interface is easy to use and smart dashboards allow for effective data visualization. Lastly, you can easily share your data maps and dashboards with your team via mobile device for easy alignment and access.
3. Astera
Price: Free 14-day trial; contact for a quote.
Astera is an enterprise data management software that uses visual interfaces to convert, map, and validate data structures for you without the need for code.
You’re able to use the tool’s drag-and-drop feature to create, debug, and manage complex data integration tasks. Astera also natively connects to a variety of database providers including SQL Server, Oracle, and DB2.
To ensure your data is of the highest quality, there’s built-in data cleansing, data profiling, and data quality options — and to improve accuracy, there are built-in transformations that remove duplicate records, complete missing information, and get rid of redundant data. You’ll get flagged and receive emails if and when your data records don’t meet the high-quality data standards.
Use Data Mapping on Your Team
Data mapping has the power to ensure your marketing team and business as a whole get the most out of your data. It also helps you maintain high-quality data and automate the processes of data integration, transfer, migration, and more. Determine which technique you'll use and if you need a tool to get started with data mapping on your team.