
Everyone wants a personalized and custom experience online, so it’s no wonder that social commerce has taken over the online shopping world.
Channels like Facebook, Instagram, Pinterest, Twitter, and WhatsApp already have thousands of businesses marketing on their platforms, and many have adopted shopping and payment functions that allow people to buy a product or service directly on the platforms.
While social commerce is relatively new, it falls under the larger umbrella of eCommerce sales, which are expected to reach $4.2 trillion this year. As a result, the revenue potential is high, and it's attracting the attention of marketers across a variety of industries.
Whether you're looking for information to boost your social media shop or shape your online strategy, read on to discover social commerce stats that will help you understand the current market and learn best practices for attracting buyers and growing your business.
Social Commerce Stats for 2021
- General Social Commerce Stats
- Social Commerce Stats by Demographic
- Social Commerce Purchasing Stats
- Social Commerce Stats by Platform
- Social Commerce Stats for Business
General Social Commerce Stats
- 35.9% of internet users in the US will make at least one social commerce purchase in 2021. (Insider Intelligence, 2021)
- US social commerce sales will surpass $36 billion in 2021, with more than 35% growth. (Insider Intelligence, 2021)
- Chinese retail social commerce sales will reach $351.65 billion in 2021. (Insider Intelligence, 2021)
- In 2021, US social commerce sales will increase from 35.8% to $36.62 billion. (Insider Intelligence, 2021)
- In China, more than 424 million people ages 14 years and up will make at least one social commerce purchase in 2021. (Insider Intelligence, 2021)
- There were almost 80 million social buyers in the US in 2020, a 30% increase from 2019. (Statista, 2021)
- Social commerce attracted investment from US companies at the start of the pandemic, in addition to online and mobile commerce. (Statista, 2021)
- 8 in 10 ten US businesses anticipate selling on social media within the next three years. (Statista, 2021)
- The number of US social commerce buyers grew to 80.1 million in 2020 and is anticipated to increase to 96.1 million in 2022. (eMarketer, 2021)
- 30% of eCommerce companies are already selling on social media, and 12% plan on selling through social media platforms in 2021. (Statista, 2021)

Social Commerce Stats by Demographic
- In the US, nearly 36% of internet users are social buyers, which is approximately 90.2 million people. (Insider Intelligence, 2021)
- In a June 2021 survey, 35% of people said social media ads influenced their purchasing decisions. The number jumped to 75% for Gen Z respondents. (Statista, 2021)
- 70% of internet users in the US who regularly watched live streams led by influencers said they were likely to buy products recommended by the influencers. (Insider Intelligence, 2021)
- Over 55% of social media users in the US aged 18 to 24 made at least one purchase through social channels, followed by users aged 25-34 years old. (Statista, 2021)
- 54% of Gen Z shoppers and 58% of Millennials agree that social platforms are better than online searches for finding out about new products. (Statista, 2021)
- The US had about 79 million social buyers in 2020, and this number is estimated to grow to 108 million by 2025. (Statista, 2021)
- $81.05 was the average value of online orders referred through social media during Q2 of 2021. (Statista, 2021)
- Apparel and accessories are the largest categories for social commerce. (Insider Intelligence, 2021)
- 11% of social media users immediately make an online purchase after discovering a product, while 44% make a purchase later on. (Statista, 2021)
- Most social media platform purchases in 2020 were in the video game and accessories category, followed by toys and hobbies and jewelry and watches. (Coupon Follow, 2021)
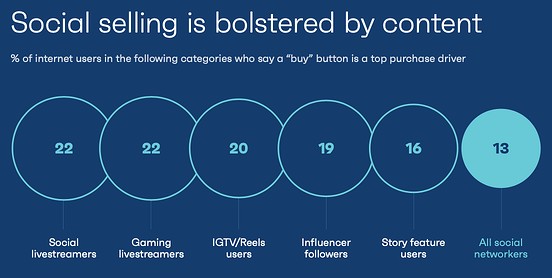
- People that use social media to access educational and inspirational content, like livestreams and stories, are eager to buy on social platforms. (GWI, 2020)
- 27% of global internet users rely on social media to find products to purchase. (GWI, 2020)
- 13% of social networkers say a "buy" button is one of the top purchase drivers. (GWI, 2020)
- Over 22% of internet users in the US were expected to make at least one purchase through Facebook in 2021. Nearly 13% were expected to shop on Instagram and over 5% were estimated to shop on Pinterest. (Statista, 2021)
- By Q1 of 2021, there were one million active Facebook Shops with over 250 million active participants every month. (AdWeek, 2021)
- With 56.1 million buyers, Facebook ranks as the top social commerce platform in the US. (Insider Intelligence, 2021)
- People who use Pinterest on a weekly basis are 7x more likely to say it’s the most influential platform in their purchase journey when compared to other social media platforms. (Pinterest, 2021)
- 85% of Pinterest shoppers have more in their basket than shoppers on other platforms. They also spend twice as much per month. (Pinterest, 2021)
- Around 40% of Pinterest users log onto the site to research brands and products. (GWI, 2020)
- In Q3 of 2021, YouTube made its ads more shoppable by allowing video action campaigns on connected TVs. (Google, 2021)
- 51% of consumers in the US and UK use YouTube to research or find products to buy. (GWI, 2020)
- Nearly 21% of tablet visits to eCommerce websites resulted from social media platform referrals in Q2 of 2020. (Statista, 2021)
- Facebook and Instagram are most used to learn about, discover, and buy fashion apparel products in the US. Over half of users said the content they see in their feeds results in a purchase. (Retail Dive, 2021)
- Over 36% of B2B decision-makers use Instagram to find out information on new products or services. (Hootsuite, 2020)
- 70% of shopping enthusiasts look to Instagram to discover new products. (Facebook, 2019)
- Every month, over 130 million users engage with Instagram shopping posts. (Instagram, 2019)
- One retail brand using Instagram Shopping, Jane, reported 80% of total social sales came from the platform between July 2020 and February 2021. (Instagram, 2021)
- 78% of US social network users discover new products through Facebook. Instagram and Pinterest come in second, both at 59%. (Net Solutions, 2021)
- Social commerce sales are predicted to value $605 billion by 2027. (Statista, 2021)
- Social commerce revenues are estimated to exceed $3.4 billion in 2028. (Statista, 2021)
- In the US, over 5% of total eCommerce retail sales will be from social commerce by 2025. (Statista, 2021)
- In a 2021 survey, 86% of marketers and agency professionals in the US reported they were enabling shopping functions in their influencer marketing campaigns. The most common function is linking to the brand's own website. (Statista, 2021)
- Advertisers anticipate spending $56 billion to promote their products on social networks in 2022. (Statista, 2021)
- 93% of US executives said their businesses are moving eCommerce efforts to social media. (Statista, 2021)
- By 2023, 71% of small businesses plan to sell on social media platforms. (Statista, 2021)
Social Commerce Purchasing Stats
- $81.05 was the average value of online orders referred through social media during Q2 of 2021. (Statista, 2021)
- Apparel and accessories are the largest categories for social commerce. (Insider Intelligence, 2021)
- 11% of social media users immediately make an online purchase after discovering a product, while 44% make a purchase later on. (Statista, 2021)
- Most social media platform purchases in 2020 were in the video game and accessories category, followed by toys and hobbies and jewelry and watches. (Coupon Follow, 2021)
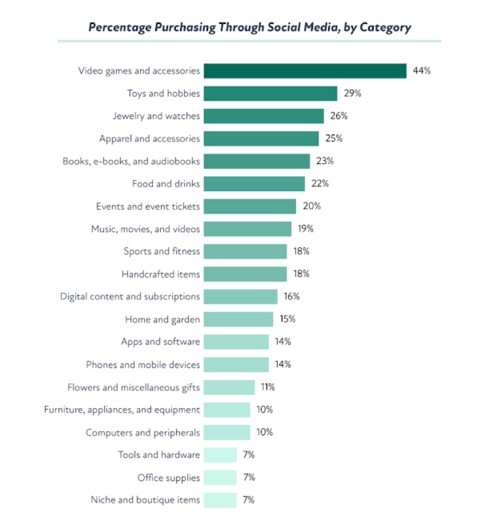
Image Source - People that use social media to access educational and inspirational content, like livestreams and stories, are eager to buy on social platforms. (GWI, 2020)
- 27% of global internet users rely on social media to find products to purchase. (GWI, 2020)
- 13% of social networkers say a "buy" button is one of the top purchase drivers. (GWI, 2020)
Social Commerce Stats by Platform
- Over 22% of internet users in the US were expected to make at least one purchase through Facebook in 2021. Nearly 13% were expected to shop on Instagram and over 5% were estimated to shop on Pinterest. (Statista, 2021)
- By Q1 of 2021, there were one million active Facebook Shops with over 250 million active participants every month. (AdWeek, 2021)
- With 56.1 million buyers, Facebook ranks as the top social commerce platform in the US. (Insider Intelligence, 2021)
- People who use Pinterest on a weekly basis are 7x more likely to say it’s the most influential platform in their purchase journey when compared to other social media platforms. (Pinterest, 2021)
- 85% of Pinterest shoppers have more in their basket than shoppers on other platforms. They also spend twice as much per month. (Pinterest, 2021)
- Around 40% of Pinterest users log onto the site to research brands and products. (GWI, 2020)
- In Q3 of 2021, YouTube made its ads more shoppable by allowing video action campaigns on connected TVs. (Google, 2021)
- 51% of consumers in the US and UK use YouTube to research or find products to buy. (GWI, 2020)
- Nearly 21% of tablet visits to eCommerce websites resulted from social media platform referrals in Q2 of 2020. (Statista, 2021)
- Facebook and Instagram are most used to learn about, discover, and buy fashion apparel products in the US. Over half of users said the content they see in their feeds results in a purchase. (Retail Dive, 2021)
- Over 36% of B2B decision-makers use Instagram to find out information on new products or services. (Hootsuite, 2020)
- 70% of shopping enthusiasts look to Instagram to discover new products. (Facebook, 2019)
- Every month, over 130 million users engage with Instagram shopping posts. (Instagram, 2019)
- One retail brand using Instagram Shopping, Jane, reported 80% of total social sales came from the platform between July 2020 and February 2021. (Instagram, 2021)
- 78% of US social network users discover new products through Facebook. Instagram and Pinterest come in second, both at 59%. (Net Solutions, 2021)
Social Commerce Stats for Business
- Social commerce sales are predicted to value $605 billion by 2027. (Statista, 2021)
- Social commerce revenues are estimated to exceed $3.4 billion in 2028. (Statista, 2021)
- In the US, over 5% of total eCommerce retail sales will be from social commerce by 2025. (Statista, 2021)
- In a 2021 survey, 86% of marketers and agency professionals in the US reported they were enabling shopping functions in their influencer marketing campaigns. The most common function is linking to the brand's own website. (Statista, 2021)
- Advertisers anticipate spending $56 billion to promote their products on social networks in 2022. (Statista, 2021)
- 93% of US executives said their businesses are moving eCommerce efforts to social media. (Statista, 2021)
- By 2023, 71% of small businesses plan to sell on social media platforms. (Statista, 2021)